How It All Works
Understanding TRMM
Anything you configure: scripts, tasks, patching, etc is queued and scheduled on the server to do something. Everything that is queued, happens immediately when agents are online. The agent gets a NATS command, the server tells it to do xyz and it does it.
When agents are not connected to the server nothing happens. The Windows Task Scheduler says do x at some time, what it's asked to do is get x command from the server. If the server is offline, nothing happens. If an agent comes online, every x interval (Windows Update, pending tasks etc) check and see if there is something for me to do that I missed while I was offline. When that time occurs (eg agent sees if it needs to update itself at 35 minutes past every hour Update Agents ) it'll get requested on the online agent.
That's the simplified general rule for everything TRMM.
Still need graphics for:
1. Agent installer steps

2. Agent checks / tasks and how they work on the workstation/interact with server
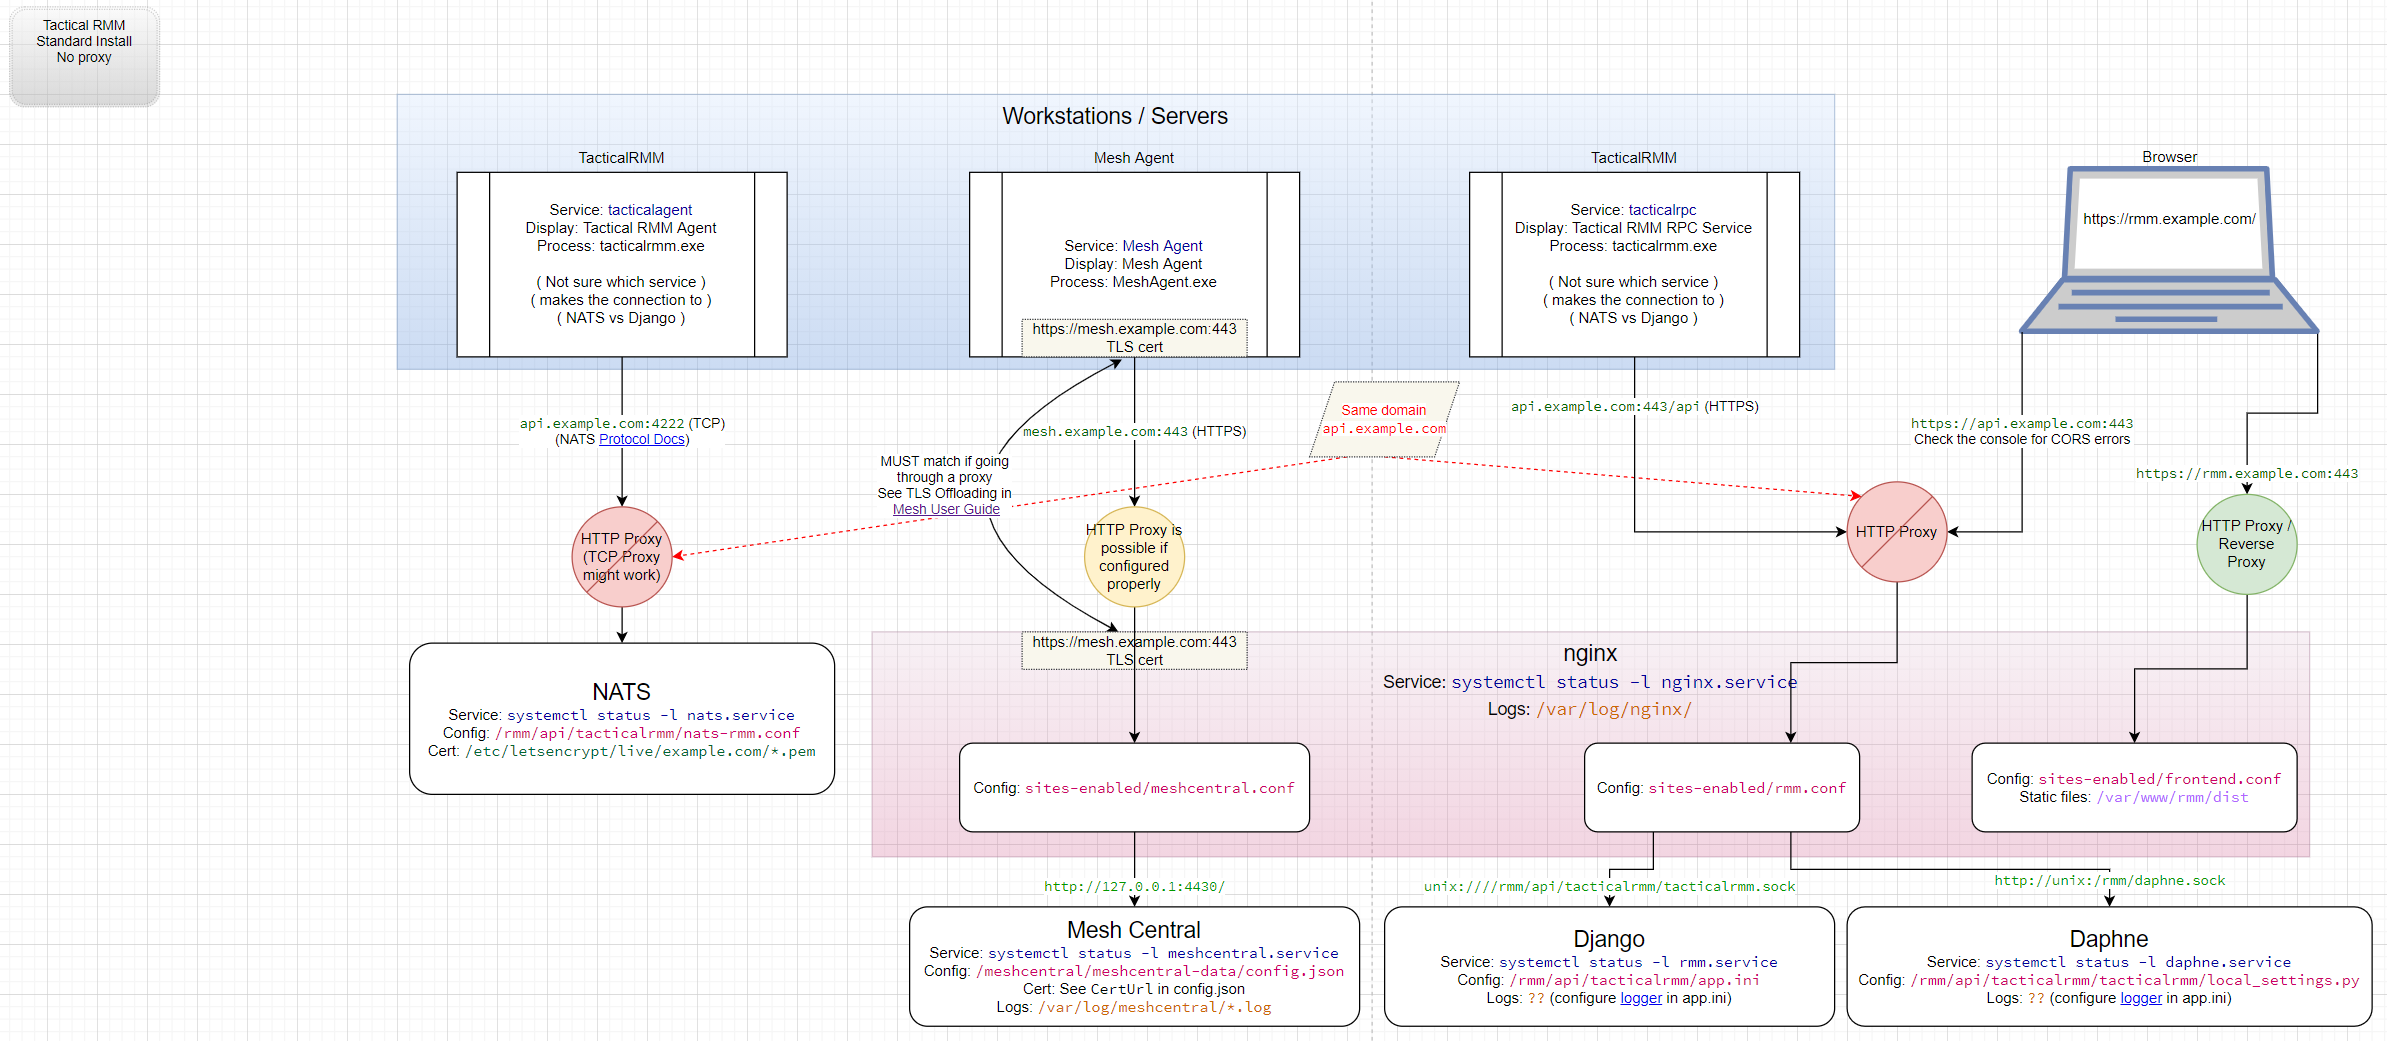
URLs in TRMM
A standard install uses 3 subdomains. What each one does and who needs to be able to reach it:
| URL | What it's for | Required for Agents | Required for Admins |
|---|---|---|---|
rmm.example.com |
The web UI (Vue frontend). It's just a web app served to your browser that sends commands to the api. URL. |
No | Yes |
api.example.com |
The Django backend and NATS. All agent communication (check-ins, tasks, checks, script results) and all web UI API calls/websockets go here. | Yes | Yes |
mesh.example.com |
MeshCentral. Used for Take Control (remote desktop) and file browser. The mesh agent on each device maintains a connection here. | Yes | Yes, when using MeshCentral features |
Note
While admins need a rmm. web app to manage the server, it doesn't have to be yours. The web app is a static frontend that anyone can build and point at any api. URL. This means restricting access to your rmm. URL provides no meaningful security - the api. URL is the actual server, and valid credentials are what protect it.
Server
Has a Postgres database located here:
Description
A web interface for the Postgres database
All Tactical RMM dependencies are listed here.
A complete list of all packages used by Tactical RMM are listed here.
Outbound Firewall Rules
If you have strict outbound firewall rules these are the outbound rules needed for all functionality:
Regular Use
- Access to Github for downloading and installing TRMM, and checking if new TRMM version is available to show in the admin web panel.
- Access to nginx.org to install
- Access to mongodb.org to install
- Access to python.org to install
- Access to postgresql.org to install
- Whatever servers Let's Encrypt uses for DNS-01 challenges
- Cloudflare is for the licensing servers.
Server Without Code Signing Key
No additional rules needed.
Server With Code Signing Key
No additional rules needed.
System Services
This lists the system services used by the server.
Quick server health inspection
cd /rmm/api/tacticalrmm/
source ../env/bin/activate
for i in active reserved scheduled stats; do celery -A tacticalrmm inspect $i; done
Nginx Web Server
Nginx is the web server for the rmm, api, and mesh domains. All sites redirect port 80 (HTTP) to port 443 (HTTPS).
nginx configuration (a.k.a. sites available)
This serves the frontend website that you interact with.
- Config:
/etc/nginx/sites-enabled/frontend.conf - root:
/var/www/rmm/dist - Access log:
/var/log/nginx/frontend-access.log - Error log:
/var/log/nginx/frontend-error.log - TLS certificate:
/etc/letsencrypt/live/example.com/fullchain.pem
This serves the TRMM API for the frontend and agents.
- Config:
/etc/nginx/sites-enabled/rmm.conf - roots:
/rmm/api/tacticalrmm/static//rmm/api/tacticalrmm/tacticalrmm/private/
- Upstreams:
unix://rmm/api/tacticalrmm/tacticalrmm.sockunix://rmm/daphne.sock
- Access log:
/rmm/api/tacticalrmm/tacticalrmm/private/log/access.log - Error log:
/rmm/api/tacticalrmm/tacticalrmm/private/log/error.log - TLS certificate:
/etc/letsencrypt/live/example.com/fullchain.pem
This serves MeshCentral for remote access.
- Config:
/etc/nginx/sites-enabled/meshcentral.conf - Upstream:
http://127.0.0.1:4430/ - Access log:
/var/log/nginx/access.log(uses default) - Error log:
/var/log/nginx/error.log(uses default) - TLS certificate:
/etc/letsencrypt/live/example.com/fullchain.pem
This is the default site installed with nginx. This listens on port 80 only.
- Config:
/etc/nginx/sites-enabled/default - root:
/var/www/rmm/dist - Access log:
/var/log/nginx/access.log(uses default) - Error log:
/var/log/nginx/error.log(uses default)
systemd config
- Status:
systemctl status --full nginx.service - Stop:
systemctl stop nginx.service - Start:
systemctl start nginx.service - Restart:
systemctl restart nginx.service - Restart:
systemctl reload nginx.servicereloads the config without restarting - Test config:
nginx -t - Listening process:
ss -tulnp | grep nginx
- Service:
nginx.service - Address:
0.0.0.0 - Port: 443
- Exec:
/usr/sbin/nginx -g 'daemon on; master_process on;' - Version: 1.18.0
- From the docker host view container status -
docker ps --filter "name=trmm-nginx" - View logs:
docker compose logs tactical-nginx - "tail" logs:
docker compose logs tactical-nginx | tail - Shell access:
docker exec -it trmm-nginx /bin/bash
Tactical RMM (Django uWSGI) Service
Built on the Django framework, the Tactical RMM service is the heart of the system by serving the API for the frontend and agents.
uWSGI config
- Status:
systemctl status --full rmm.service - Stop:
systemctl stop rmm.service - Start:
systemctl start rmm.service - Restart:
systemctl restart rmm.service - journalctl:
- "tail" the logs:
journalctl --identifier uwsgi --follow - View the logs:
journalctl --identifier uwsgi --since "30 minutes ago" | less - Debug logs for 5xx errors will be located in
/rmm/api/tacticalrmm/tacticalrmm/private/log
- "tail" the logs:
- Service:
rmm.service - Socket:
/rmm/api/tacticalrmm/tacticalrmm.sock - uWSGI config:
/rmm/api/tacticalrmm/app.ini - Log: None
- Journal identifier:
uwsgi - Version: 2.0.18
- From the docker host view container status -
docker ps --filter "name=trmm-backend" - View logs:
docker compose logs tactical-backend - "tail" logs:
docker compose logs tactical-backend | tail - Shell access:
docker exec -it trmm-backend /bin/bash
Daphne: Django Channels Daemon
Daphne is the official ASGI HTTP / WebSocket server maintained by the Channels project.
Daphne config
- Django Channels configuration docs
- Status:
systemctl status --full daphne.service - Stop:
systemctl stop daphne.service - Start:
systemctl start daphne.service - Restart:
systemctl restart daphne.service - journalctl (this provides only system start/stop logs, not the actual logs):
- "tail" the logs:
journalctl --identifier daphne --follow - View the logs:
journalctl --identifier daphne --since "30 minutes ago" | less
- "tail" the logs:
- Service:
daphne.service - Socket:
/rmm/daphne.sock - Exec:
/rmm/api/env/bin/daphne -u /rmm/daphne.sock tacticalrmm.asgi:application - Config:
/rmm/api/tacticalrmm/tacticalrmm/local_settings.py - Log:
/rmm/api/tacticalrmm/tacticalrmm/private/log/trmm_debug.log
- From the docker host view container status -
docker ps --filter "name=trmm-websockets" - View logs:
docker compose logs tactical-websockets - "tail" logs:
docker compose logs tactical-websockets | tail - Shell access:
docker exec -it trmm-websockets /bin/bash
NATS Server Service
NATS is a messaging bus for "live" communication between the agent and server. NATS provides the framework for the server to push commands to the agent and receive information back.
NATS config
- Status:
systemctl status --full nats.service - Stop:
systemctl stop nats.service - Start:
systemctl start nats.service - Restart:
systemctl restart nats.service - Reload:
systemctl reload nats.servicereloads the config without restarting - journalctl:
- "tail" the logs:
journalctl --identifier nats-server --follow - View the logs:
journalctl --identifier nats-server --since "30 minutes ago" | less
- "tail" the logs:
- Listening process:
ss -tulnp | grep nats-server - Checking for NATS or websocket problems
sudo journalctl --no-pager -u natsandsudo journalctl --no-pager -u nats-api
- Service:
nats.service - Address:
0.0.0.0 - Port:
4222 (standard), 9235 (websocket) - Exec:
/usr/local/bin/nats-server --config /rmm/api/tacticalrmm/nats-rmm.conf - Config:
/rmm/api/tacticalrmm/nats-rmm.conf- TLS:
/etc/letsencrypt/live/example.com/fullchain.pem
- TLS:
- Log: None
- Version: v2.3.3
- Get into bash in your docker with:
docker exec -it trmm-nats /bin/bash - Log:
nats-api -log debug - Shell access:
docker exec -it trmm-nats /bin/bash
NATS API Service
NATS API config
- Status:
systemctl status --full nats-api.service - Stop:
systemctl stop nats-api.service - Start:
systemctl start nats-api.service - Restart:
systemctl restart nats-api.service - journalctl: This application does not appear to log anything.
- Service:
nats-api.service - Exec:
/usr/local/bin/nats-api --config /rmm/api/tacticalrmm/nats-api.conf - Config:
/rmm/api/tacticalrmm/nats-api.conf- TLS:
/etc/letsencrypt/live/example.com/fullchain.pem
- TLS:
- Log: None
- Get into bash in your docker with:
docker exec -it trmm-nats /bin/bash - Log:
nats-api -log debug
Celery Service
Celery is a task queue focused on real-time processing and is responsible for scheduling tasks to be sent to agents.
Log located at /var/log/celery
Celery config
- Status:
systemctl status --full celery.service - Stop:
systemctl stop celery.service - Start:
systemctl start celery.service - Restart:
systemctl restart celery.service - journalctl: Celery executes
shcausing the systemd identifier to besh, thus mixing theceleryandcelerybeatlogs together.- "tail" the logs:
journalctl --identifier sh --follow - View the logs:
journalctl --identifier sh --since "30 minutes ago" | less
- "tail" the logs:
- Tail logs:
tail -F /var/log/celery/w*-*.log
- Service:
celery.service - Exec:
/bin/sh -c '${CELERY_BIN} -A $CELERY_APP multi start $CELERYD_NODES --pidfile=${CELERYD_PID_FILE} --logfile=${CELERYD_LOG_FILE} --loglevel="${CELERYD_LOG_LEVEL}" $CELERYD_OPTS' - Config:
/etc/conf.d/celery.conf - Log:
/var/log/celery/w*-*.log
- From the docker host view container status -
docker ps --filter "name=trmm-celery" - View logs:
docker compose logs tactical-celery - "tail" logs:
docker compose logs tactical-celery | tail - Shell access:
docker exec -it trmm-celery /bin/bash
Celery Beat Service
Celery Beat is a scheduler. It kicks off tasks at regular intervals, that are then executed by available worker nodes in the cluster.
Celery Beat config
- Status:
systemctl status --full celerybeat.service - Stop:
systemctl stop celerybeat.service - Start:
systemctl start celerybeat.service - Restart:
systemctl restart celerybeat.service - journalctl: Celery executes
shcausing the systemd identifier to besh, thus mixing theceleryandcelerybeatlogs together.- "tail" the logs:
journalctl --identifier sh --follow - View the logs:
journalctl --identifier sh --since "30 minutes ago" | less
- "tail" the logs:
- Tail logs:
tail -F /var/log/celery/beat.log
- Service:
celerybeat.service - Exec:
/bin/sh -c '${CELERY_BIN} -A ${CELERY_APP} beat --pidfile=${CELERYBEAT_PID_FILE} --logfile=${CELERYBEAT_LOG_FILE} --loglevel=${CELERYD_LOG_LEVEL}' - Config:
/etc/redis/redis.conf - Log:
/var/log/celery/beat.log
- From the docker host view container status -
docker ps --filter "name=trmm-celerybeat" - View logs:
docker compose logs tactical-celerybeat - "tail" logs:
docker compose logs tactical-celerybeat | tail - Shell access:
docker exec -it trmm-celerybeat /bin/bash
Redis Service
Redis is an in-memory data structure store used as a database, cache, and message broker for Django / Celery.
Log located at /var/log/redis
Redis config
- Status:
systemctl status --full redis-server.service - Stop:
systemctl stop redis-server.service - Start:
systemctl start redis-server.service - Restart:
systemctl restart redis-server.service - Tail logs:
tail -F /var/log/redis/redis-server.log
- Service:
redis-server.service - Log:
/var/log/redis/redis-server.log
- From the docker host view container status -
docker ps --filter "name=trmm-redis" - View logs:
docker compose logs tactical-redis - "tail" logs:
docker compose logs tactical-redis | tail - Shell access:
docker exec -it trmm-redis /bin/bash
MeshCentral
MeshCentral is used for "Take Control" (connecting to machine for remote access), and 1 screen of the "Remote Background" (File Browser).
Config file location:
/meshcentral/meshcentral-data/config.json
Customize with care.
Info
Mesh usernames are CaSe sEnSiTive. Tactical will make sure it's all lower case to avoid sync problems.
MeshCentral
- Status:
systemctl status --full meshcentral - Stop:
systemctl stop meshcentral - Start:
systemctl start meshcentral - Restart:
systemctl restart meshcentral
- From the docker host view container status -
docker ps --filter "name=trmm-meshcentral" - View logs:
docker compose logs tactical-meshcentral - "tail" logs:
docker compose logs tactical-meshcentral | tail - Shell access:
docker exec -it trmm-meshcentral /bin/bash
- Open either "Take Control" or "Remote Background" to get mesh login token.
- Open https://mesh.example.com to open native mesh admin interface.
- Left-side "My Server" > Choose "Console" > type
agentstats - To view detailed logging goto "Trace" > click Tracing button and choose categories.
If you run sudo systemctl status --full --no-pager meshcentral and you don't see Active: active (running) since ...
You can manually run meshcentral using this command to see the full output with errors.
sudo systemctl stop meshcentral
cd /meshcentral/
/usr/bin/node node_modules/meshcentral
MeshCentral Agent
Get Mesh Agent Version info with this command. Should match server version.
"C:\Program Files\Mesh Agent\MeshAgent.exe" -info"
Checks / tasks / agent data uses regular http to Nginx.
Agent status uses NATS websockets.
Other Dependencies
Django - Framework to enable the server to interact with browser.
Django dependencies
future==0.18.2
loguru==0.5.3
msgpack==1.0.2
packaging==20.9
psycopg2-binary==2.9.1
pycparser==2.20
pycryptodome==3.10.1
pyotp==2.6.0
pyparsing==2.4.7
pytz==2021.1
qrcode - Creating QR codes for 2FA.
qrcode dependencies
requests==2.25.1
six==1.16.0
sqlparse==0.4.1
Twilio - Python SMS notification integration.
twilio dependencies
urllib3==1.26.5
uWSGI==2.0.19.1
validators==0.18.2
vine==5.0.0
websockets==9.1
zipp==3.4.1
Windows Agent
Found in %programfiles%\TacticalAgent
The Tactical RMM agent runs under the SYSTEM security context.
When scripts / checks execute, they are:
- Transferred from the server via NATS.
- Saved to a randomly created file in
C:\ProgramData\TacticalRMM. - Executed.
- Return info is captured and returned to the server via NATS.
- File in
C:\ProgramData\TacticalRMMis removed automatically after execution / timeout. - Command Parameters for scripts stay in memory
Also "Send Command" stay in memory as well.
Having said that...Windows logs all things PowerShell: Event Viewer > Microsoft > Windows > PowerShell > Operational Log so be careful with fancy API calls and auth token using agents for execution.
Warning
Remember: Auth tokens are Username/Password/2FA verification all rolled into a single chunk of text!
RunAsUser functionality
Now that we know the agent runs under the SYSTEM security context and what that means, there is an option to "RunAsUser" (Windows only).
There are multiple things to understand and consider.
- TRMMs native "RunAsUser" is only supported on workstations and non-RDP/terminal services servers.
- The user has to be logged in, if the computer is still sitting at the Login screen there will be no active user to discover, and fail. If you're using fast user switching, it is the active user that will be discovered and used.
There are two ways to do RunAsUser with tactical in relation to scripting.
- The Tactical RMM "RunAsUser" checkbox associated with the script, and all code will be run under the actively logged in user only with their security permissions. The user access token that will be used is the limited user access token. You will not be able to do any admin level stuff because TRMM's RunAsUser doesn't have a UAC elevation capability to call and request a 2nd access token with admin privileges.
- Using the PowerShell "RunAsUser" 3rd party module
Outbound Firewall Rules
If you have strict firewall rules these are the only outbound rules from the agent needed for all functionality:
-
All agents have to be able to connect outbound to TRMM server on the 3 domain names on port 443.
-
The agent uses
https://icanhazip.tacticalrmm.io/to get public IP info. If this site is down for whatever reason, the agent will fallback tohttps://icanhazip.comand thenhttps://ifconfig.co/ip
Unsigned Agents
Unsigned agents require access to: https://github.com/amidaware/rmmagent/releases/* for downloading / updating agents.
Signed Agents
Signed agents require access to: https://agents.tacticalrmm.com for downloading / updating agents.
Agent Installation Process
- Copies temp files to
C:\ProgramData\TacticalRMMfolder. - INNO setup installs app into
%ProgramFiles%\TacticalAgent\folder.
Agent Update Process
Downloads latest tacticalagent-vx.x.x.exe to %PROGRAMDATA\TacticalRMM%.
Executes the file (INNO setup exe).
Log file C:\ProgramData\TacticalRMM\tacticalagent_update_vX.X.X.txt is created.
Tactical Agent Debugging
Choose your method:
If the Tactical agent is connecting to your server, you can use the Community scripts:
TacticalRMM - TRMM Agent enable Debug ModeTacticalRMM - TRMM Agent disable Debug Mode- and
TacticalRMM - Get Agent Logs
Open CMD as admin on the problem computer and stop the agent services:
net stop tacticalrmm
Run the tacticalrmm service manually with debug logging:
"C:\Program Files\TacticalAgent\tacticalrmm.exe" -m rpc -log debug -logto stdout
Note
There's a Community script that will collect your agent log called TacticalRMM - Get Agent Logs.
As root user, edit:
vi /etc/systemd/system/tacticalagent.service
Change
ExecStart=/usr/local/bin/tacticalagent -m svc
to
ExecStart=/usr/local/bin/tacticalagent -m svc -log debug
then
systemctl daemon-reload
systemctl restart tacticalagent.service
In terminal window:
sudo launchtl list | grep -e mesh -e tacticalagent
Mesh Agent Recovery
Use Agents right click menu > Agent recovery > Mesh Agent
Tactical Agent Recovery
Use Agents right click menu > Agent recovery > Tactical Agent
...OR
Connect to Terminal (Admin Shell)
Run
net stop tacticalrmm
net start tacticalrmm
Check if Tactical RMM agent is online.
Start / Restart Tactical RMM service from either services.msc or from Admin Command prompt:
net stop tacticalrmm
net start tacticalrmm
Open C:\Program Files\TacticalAgent\agent.log to look for issues.
Windows Update Management
The current Tactical RMM Windows Update process is relatively simple atm. As of right now, it is in the top 3 big items to be reworked.
TLDR: Tactical RMM Based Patching Recommendation
- Use the
Automation Policy>Patch Policyto apply it to machines. TheOthercategory is poorly named by Microsoft, those are the regular monthly updates and should be auto-approved. - Be patient, and things will be patched (based on the policy).
- Trying to immediately approve patches to many machines OR block specific patches is a slow and manual process.
Note
If you want more control of Windows patching right now, look into a script-based implementation of PSWindowsUpdate.
Be aware: When you install the Tactical RMM Agent on a Windows computer it sets this:
HKEY_LOCAL_MACHINE\SOFTWARE\Policies\Microsoft\Windows\WindowsUpdate\AU
AUOptions (REG_DWORD):
1: Keep my computer up to date is disabled in Automatic Updates.
If you want to resume normal Windows patching and disable Tactical RMM updating functions, you should run this.
Where does it get updates from? TRMM gets the list of Windows updates using this Microsoft API: https://docs.microsoft.com/en-us/windows/win32/api/_wua/
The Tactical RMM server updates an agent's patch list every 8 hours based on the patch policy to check for what to update, and what's installed.
Note
Currently if the agent is not online at the time the patch policy is set to install, there is no "install as soon as it comes online".
Tip
Trying to get reboots to happen at specific times after Windows update? Set your Reboot After Installation to: Never
Then create a task that reboots at your preferred date/time
Log Files
You can find 3 sets of detailed logs at /rmm/api/tacticalrmm/tacticalrmm/private/log.
error.logNginx log for all errors on all TRMM URL's: rmm, api and mesh
tail -f /rmm/api/tacticalrmm/tacticalrmm/private/log/error.log
access.logNginx log for auditing access on all URL's: rmm, api and mesh (this is a large file, and should be cleaned periodically)
tail -f /rmm/api/tacticalrmm/tacticalrmm/private/log/access.log
django_debug.logcreated by Django webapp
tail -f /rmm/api/tacticalrmm/tacticalrmm/private/log/django_debug.log
Failed / Successful Admin logins
These are logged in /rmm/api/tacticalrmm/tacticalrmm/private/log/access.log
Successful Login
10.0.0.18 - - [21/May/2025:00:01:43 -0400] "POST /v2/checkcreds/ HTTP/1.1" 200 13 "https://rmm.example.com/" "Mozilla/5.0 (Windows NT 10.0; Win64; x64) AppleWebKit/537.36 (KHTML, like Gecko) Chrome/136.0.0.0 Safari/537.36"
Failed Login
10.0.8.62 - - [21/May/2025:00:01:13 -0400] "POST /v2/checkcreds/ HTTP/1.1" 400 17 "https://rmm.example.com/" "Mozilla/5.0 (Windows NT 10.0; Win64; x64) AppleWebKit/537.36 (KHTML, like Gecko) Chrome/136.0.0.0 Safari/537.36"
| Field | Description |
|---|---|
10.0.0.18 |
Client IP address |
- |
Unused (RFC 1413 identity) |
- |
Unused (authenticated user ID) |
[21/May/2025:00:01:43 -0400] |
Timestamp (local time with timezone offset) |
"POST /v2/checkcreds/ HTTP/1.1" |
HTTP request method, path, and version |
200 |
HTTP status code (200 = OK/success) (400 = Failed) |
13 |
Response size in bytes (body only) |
"https://rmm.example.com/" |
Referer URL (origin of the request) |
"Mozilla/5.0 (Windows NT 10.0;...) |
User-Agent string (browser and OS info) |
Fail2Ban uses this to limit password guessing